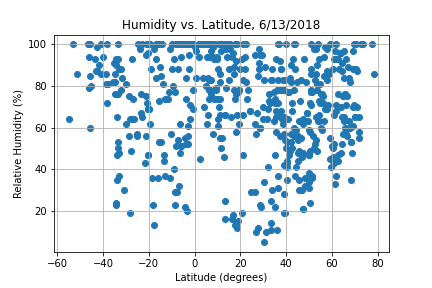
This graph compares the humidity in each city with its latitude. The data are spread out across the graph without much of an obvious pattern. There are many points that lie between 60% and 100% humidity, spanning the range of latitudes. There are also two main "legs" of the table where the relative humidity is lower. In the southern hemisphere, this is centered around 20 degrees South latitude, while in the northern hemisphere it is more broad, spanning from about 20 degrees to 60 degrees North latitude.