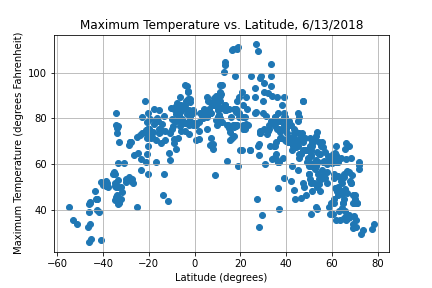
In this graph, I'm comparing the maximum measured temperature in each city to its latitude. There is an inverted "U"-shaped distribution, and the data are clearly grouped together. Rhe highest part of the inverted "U" is around 20 degrees north. This makes sense because June 13th, 2018 is in the summer in the northern hemisphere. On the summer solstice (June 21st, 2018), the Sun appears directly overhead at latitude ~23.5 degrees North. Areas around 23.5 degrees North experience the most direct sunlight in the northern hemisphere summer, so they tend to be some of the hottest areas.